
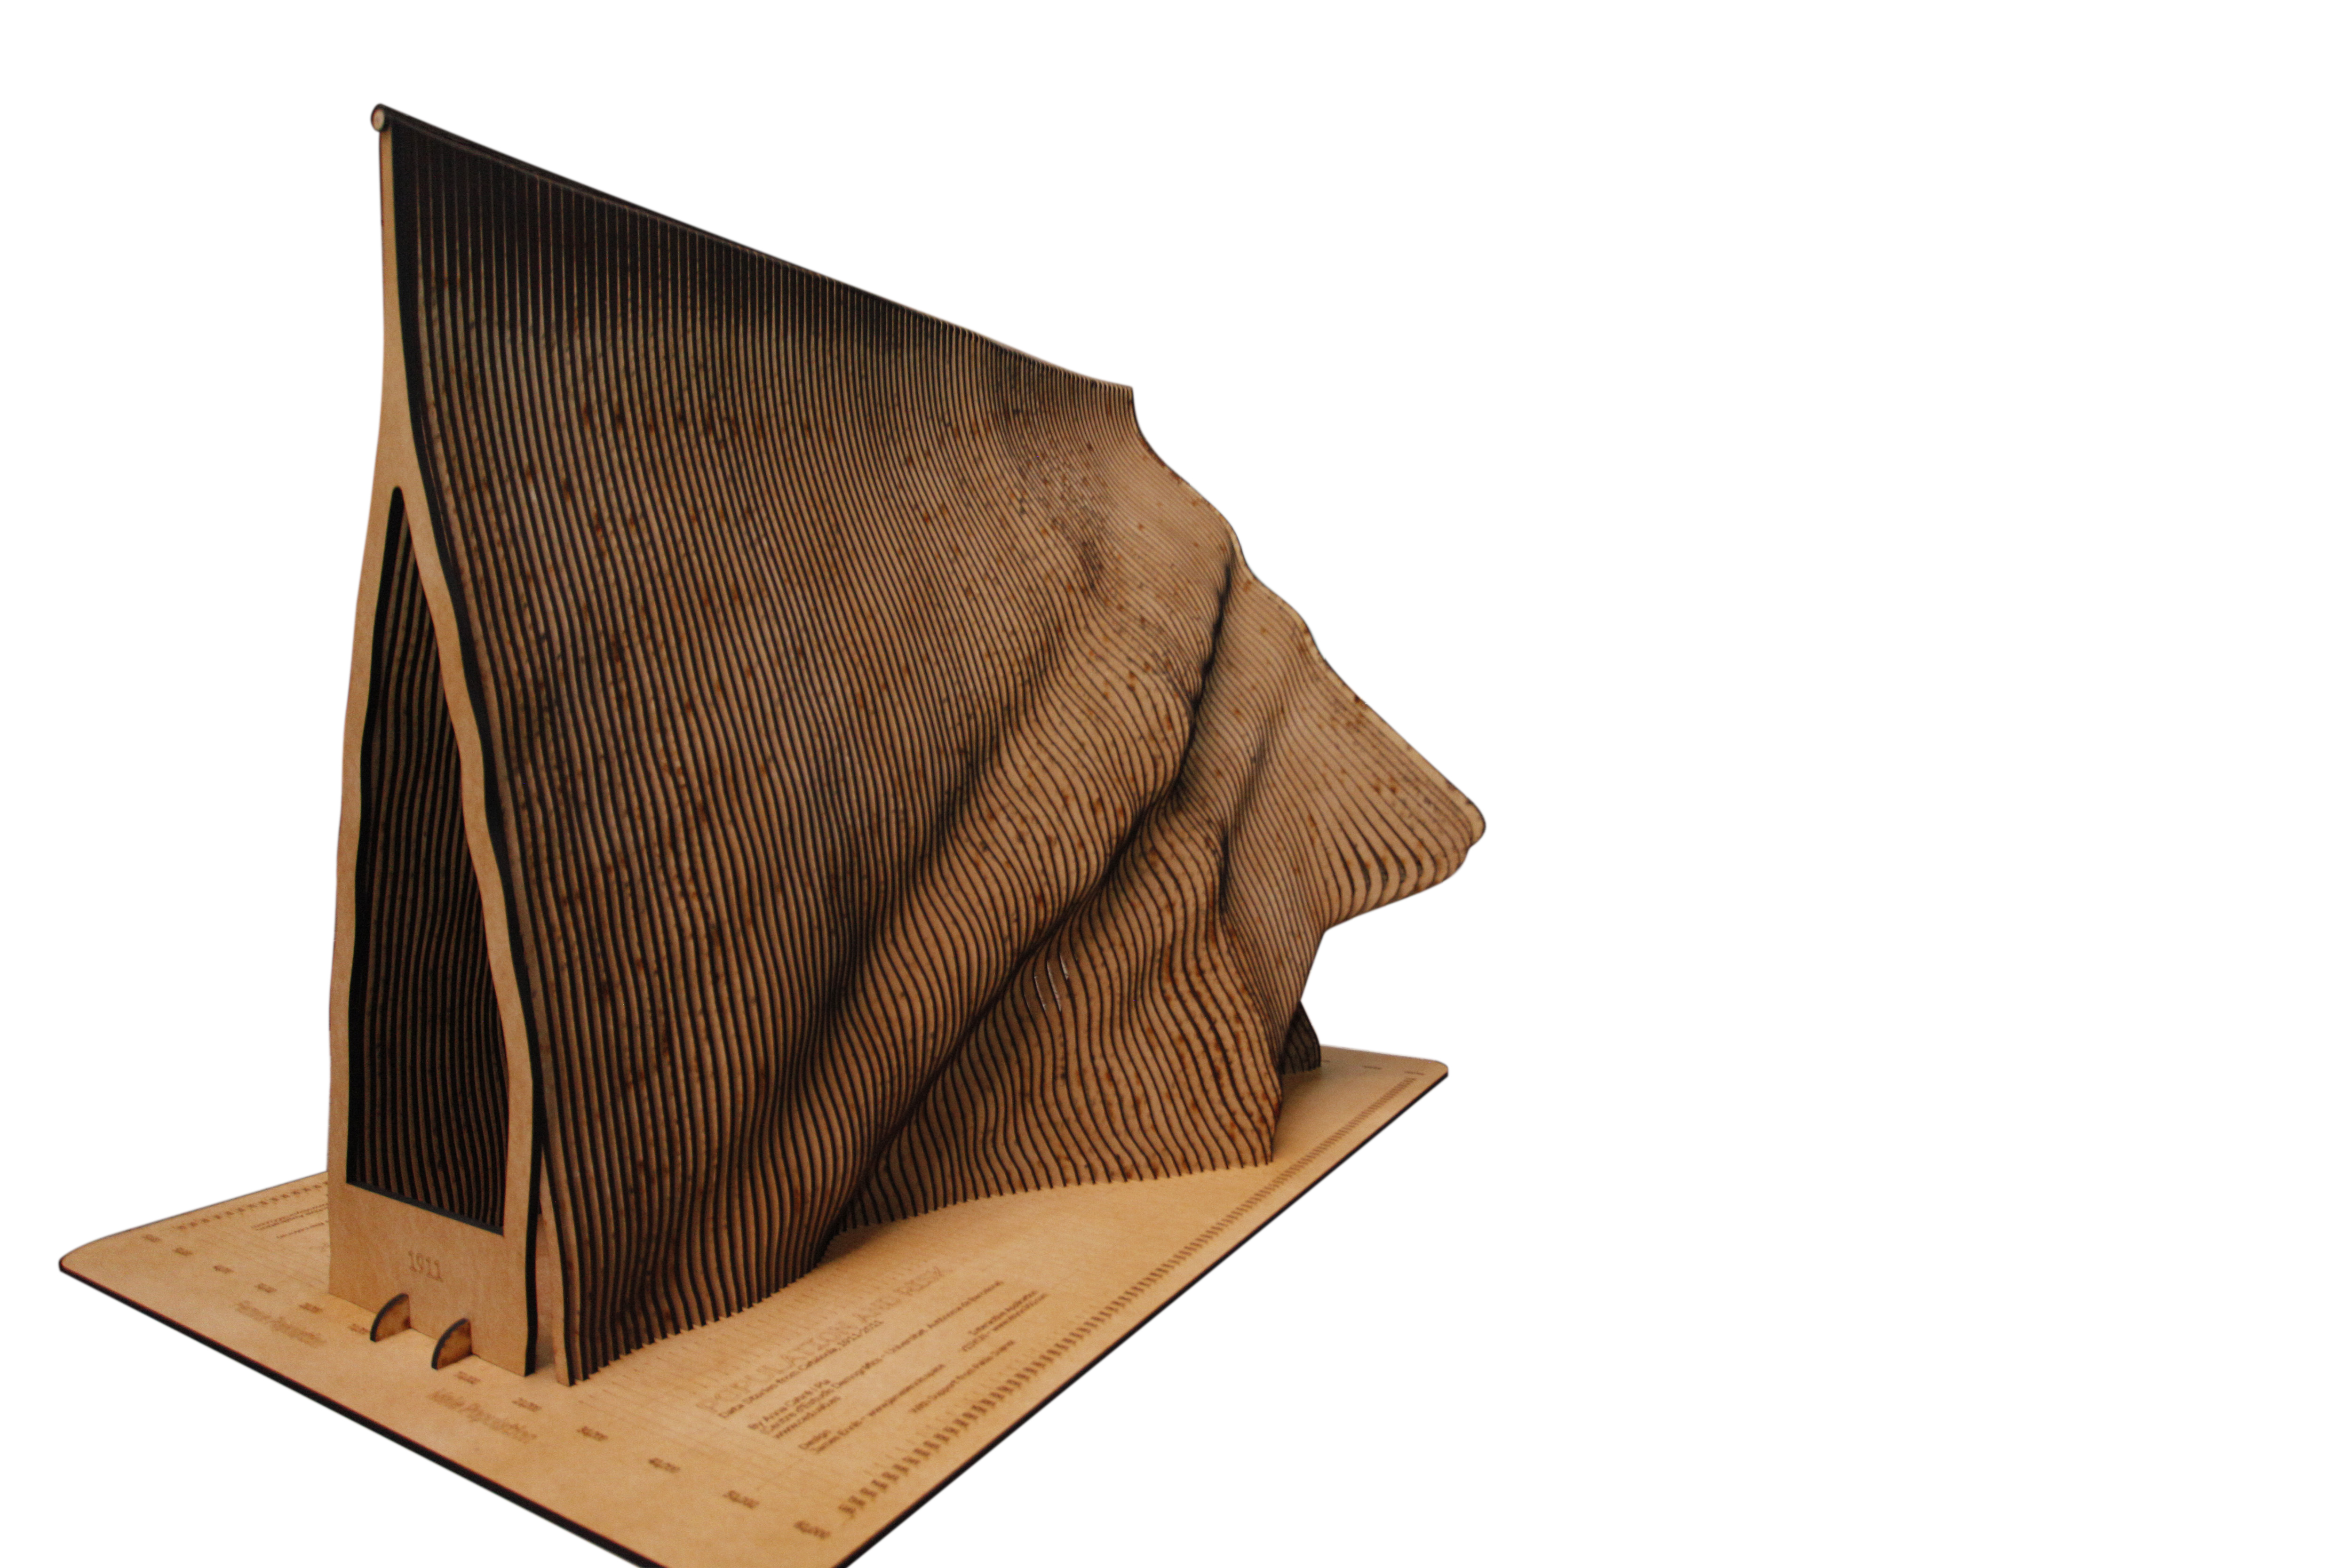
Population Pyramid
Data Visualization
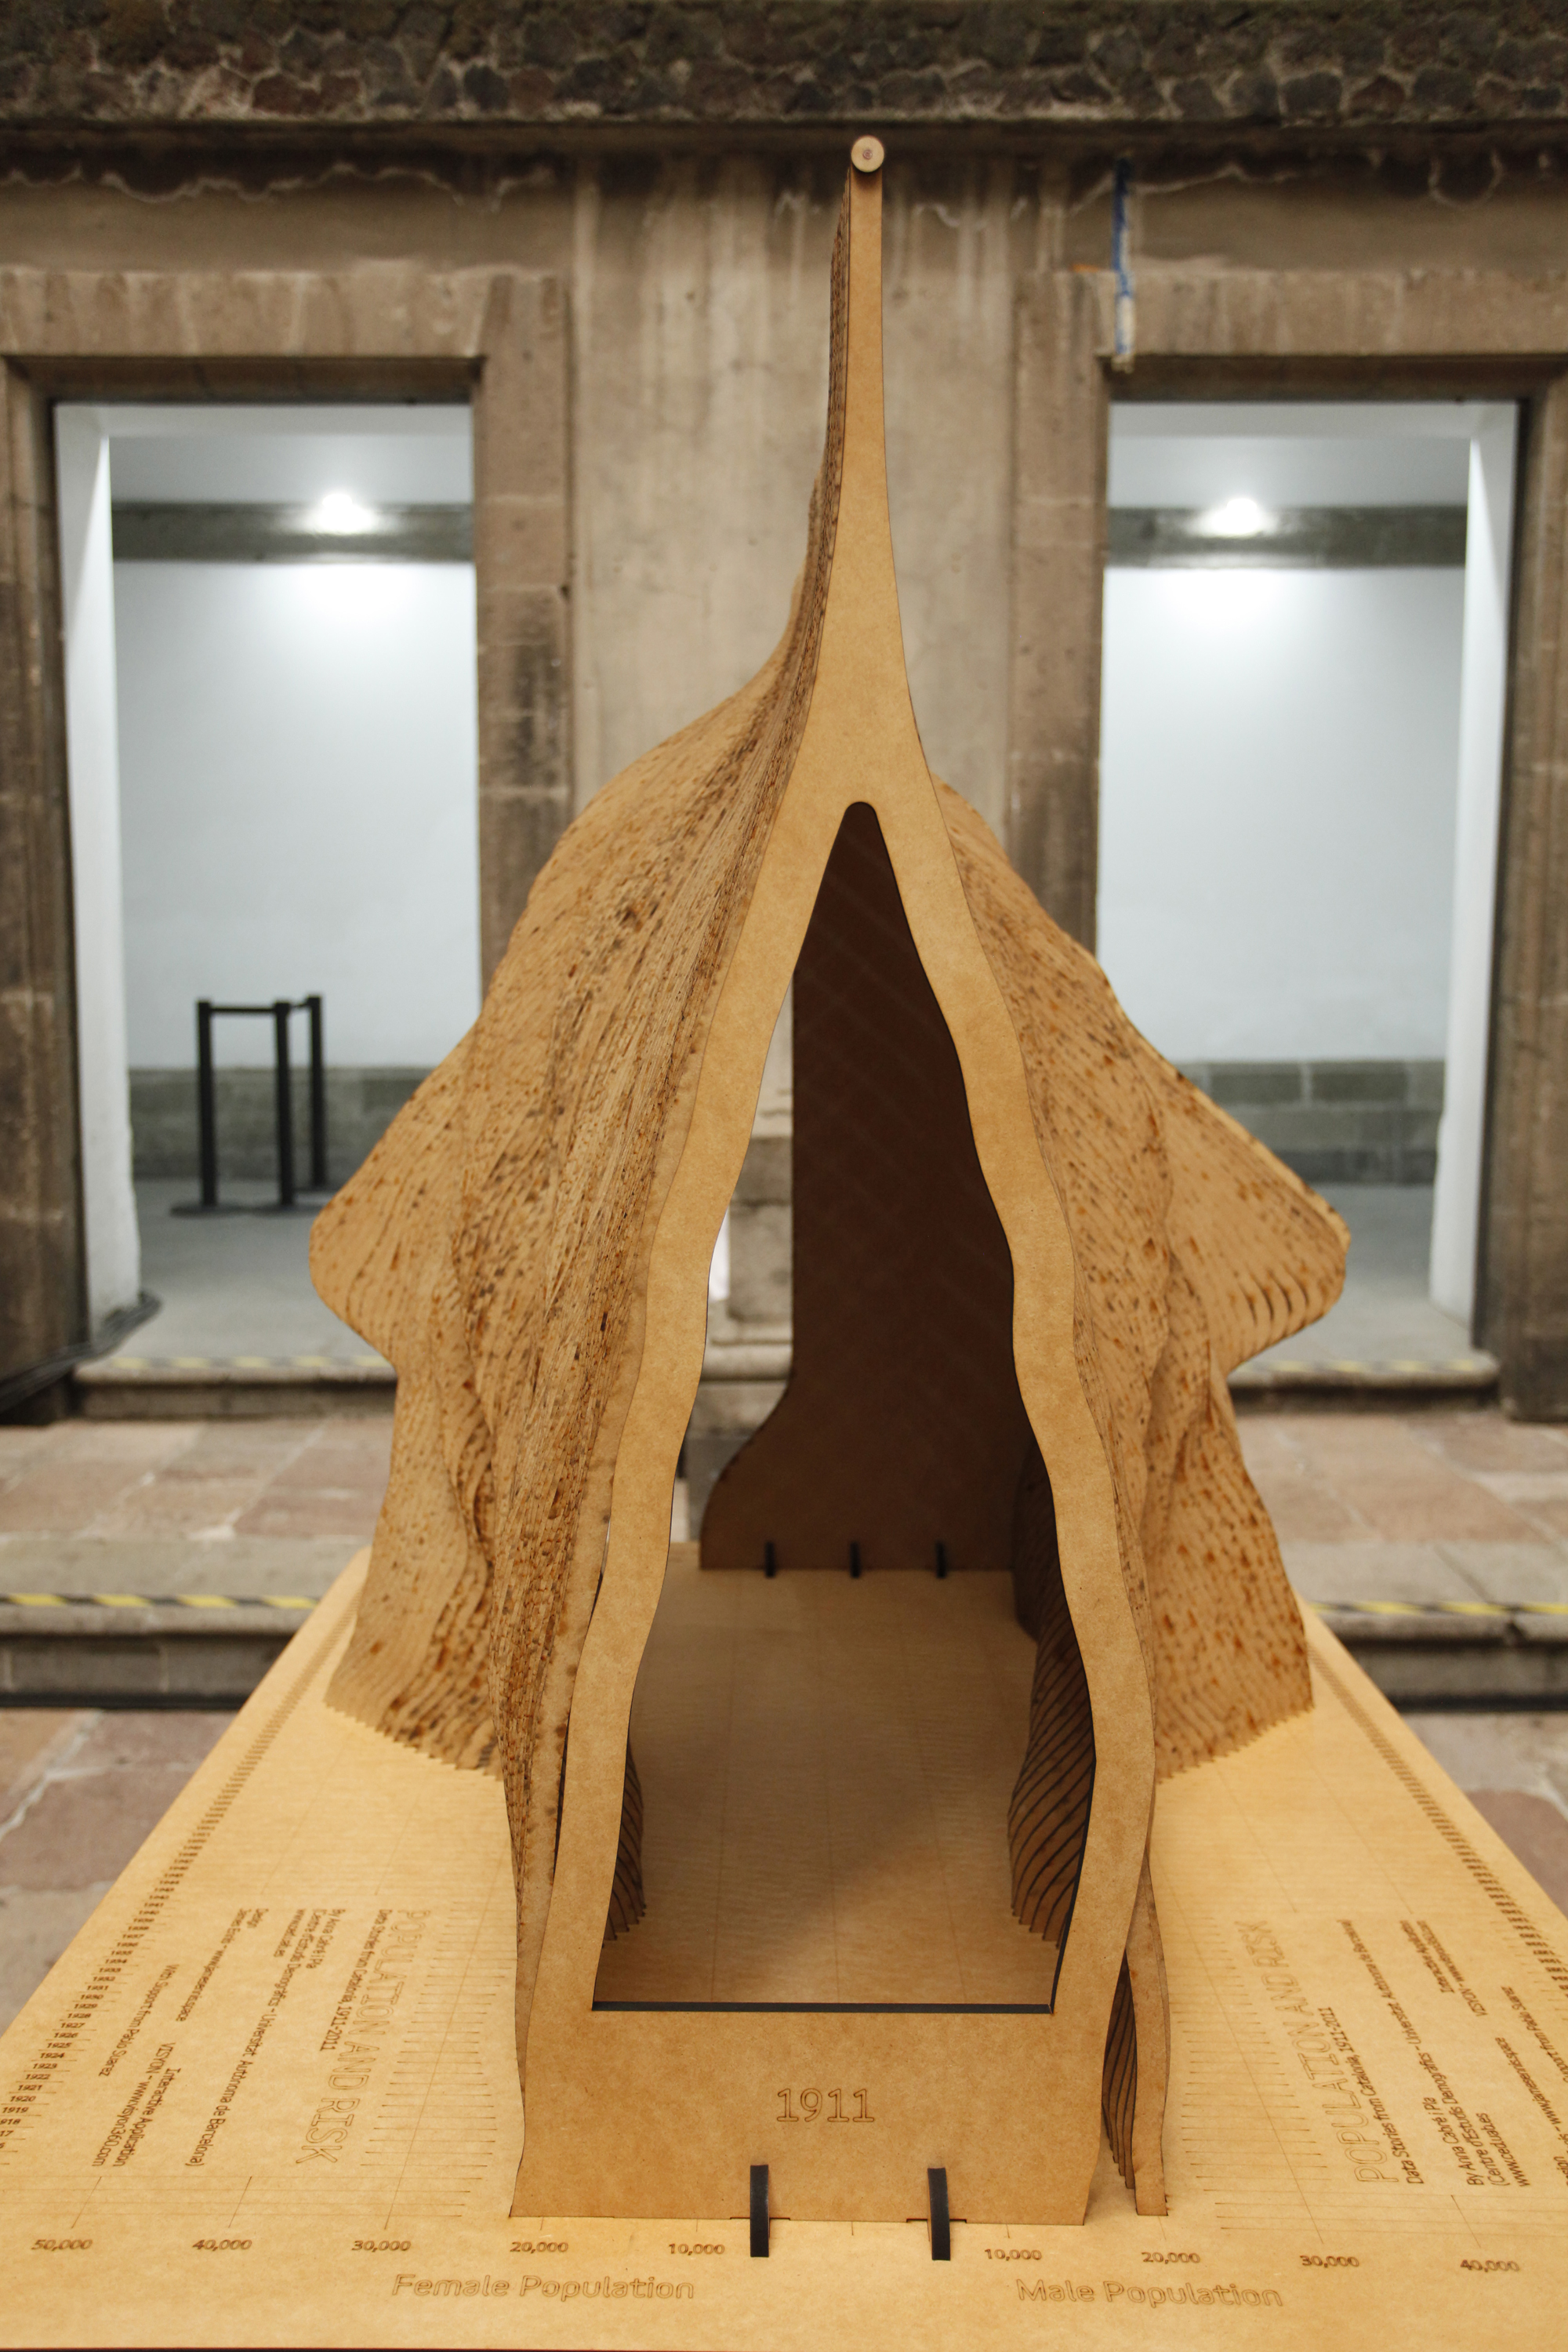
A Population Pyramid, Data Stories from Catalonia, 1911-2011. Developed for the Understanding Risk Forum 2018, Mexico City, for the World Bank.
Data generated by by Anna Cabré i Pla, (Centre d’Estudis Demogràfics ~ www.ced.uab.es, Universitat Autònoma de Barcelona). The Augmented layer developed with VISYON ~ www.visyon360.com, with Support from Pablo Suarez.
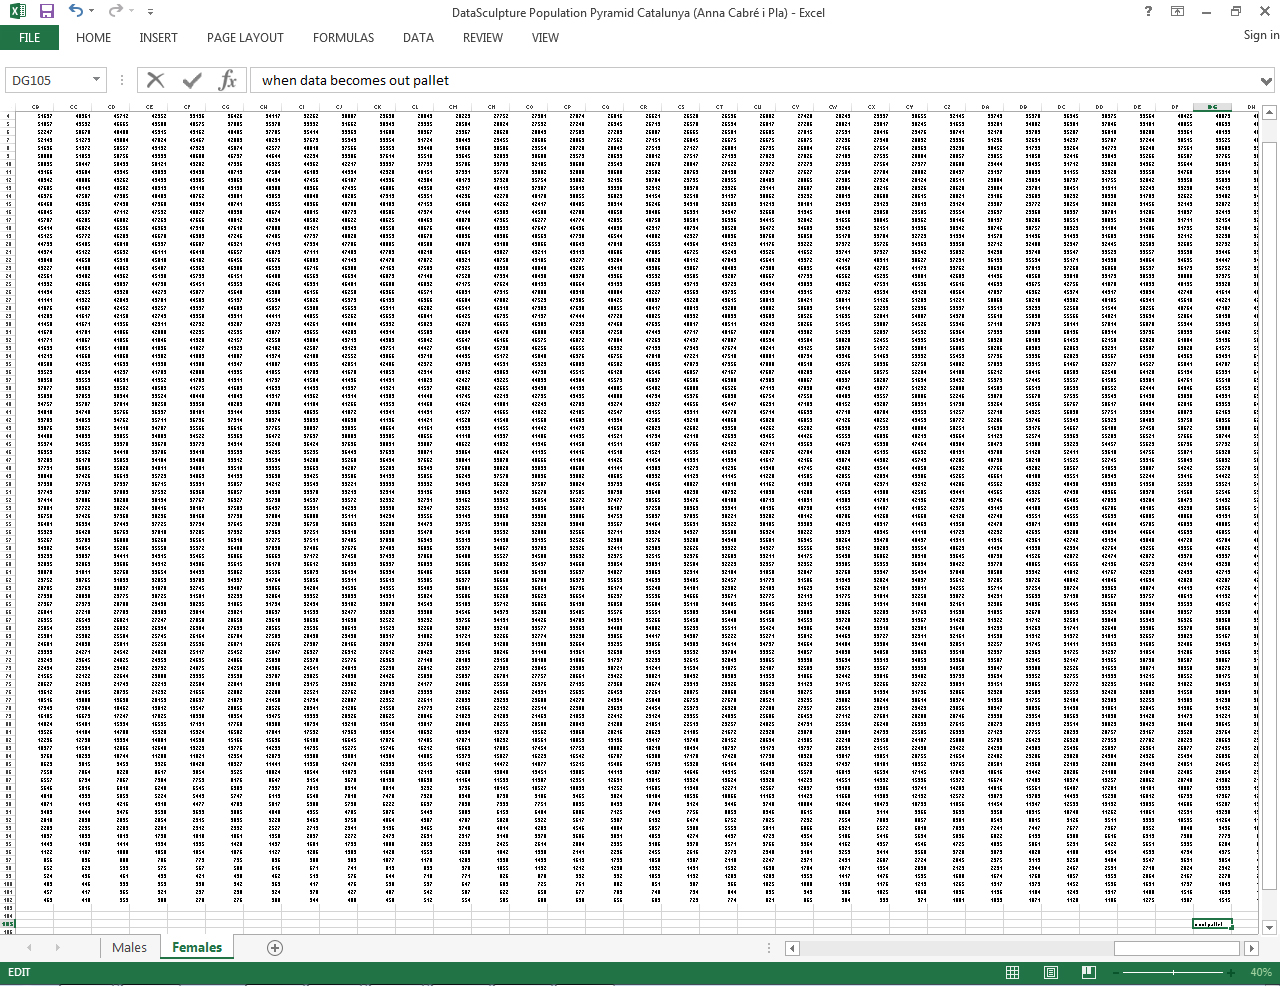
When data becomes the pallet? 2 sheets, male and female data, for 100 years
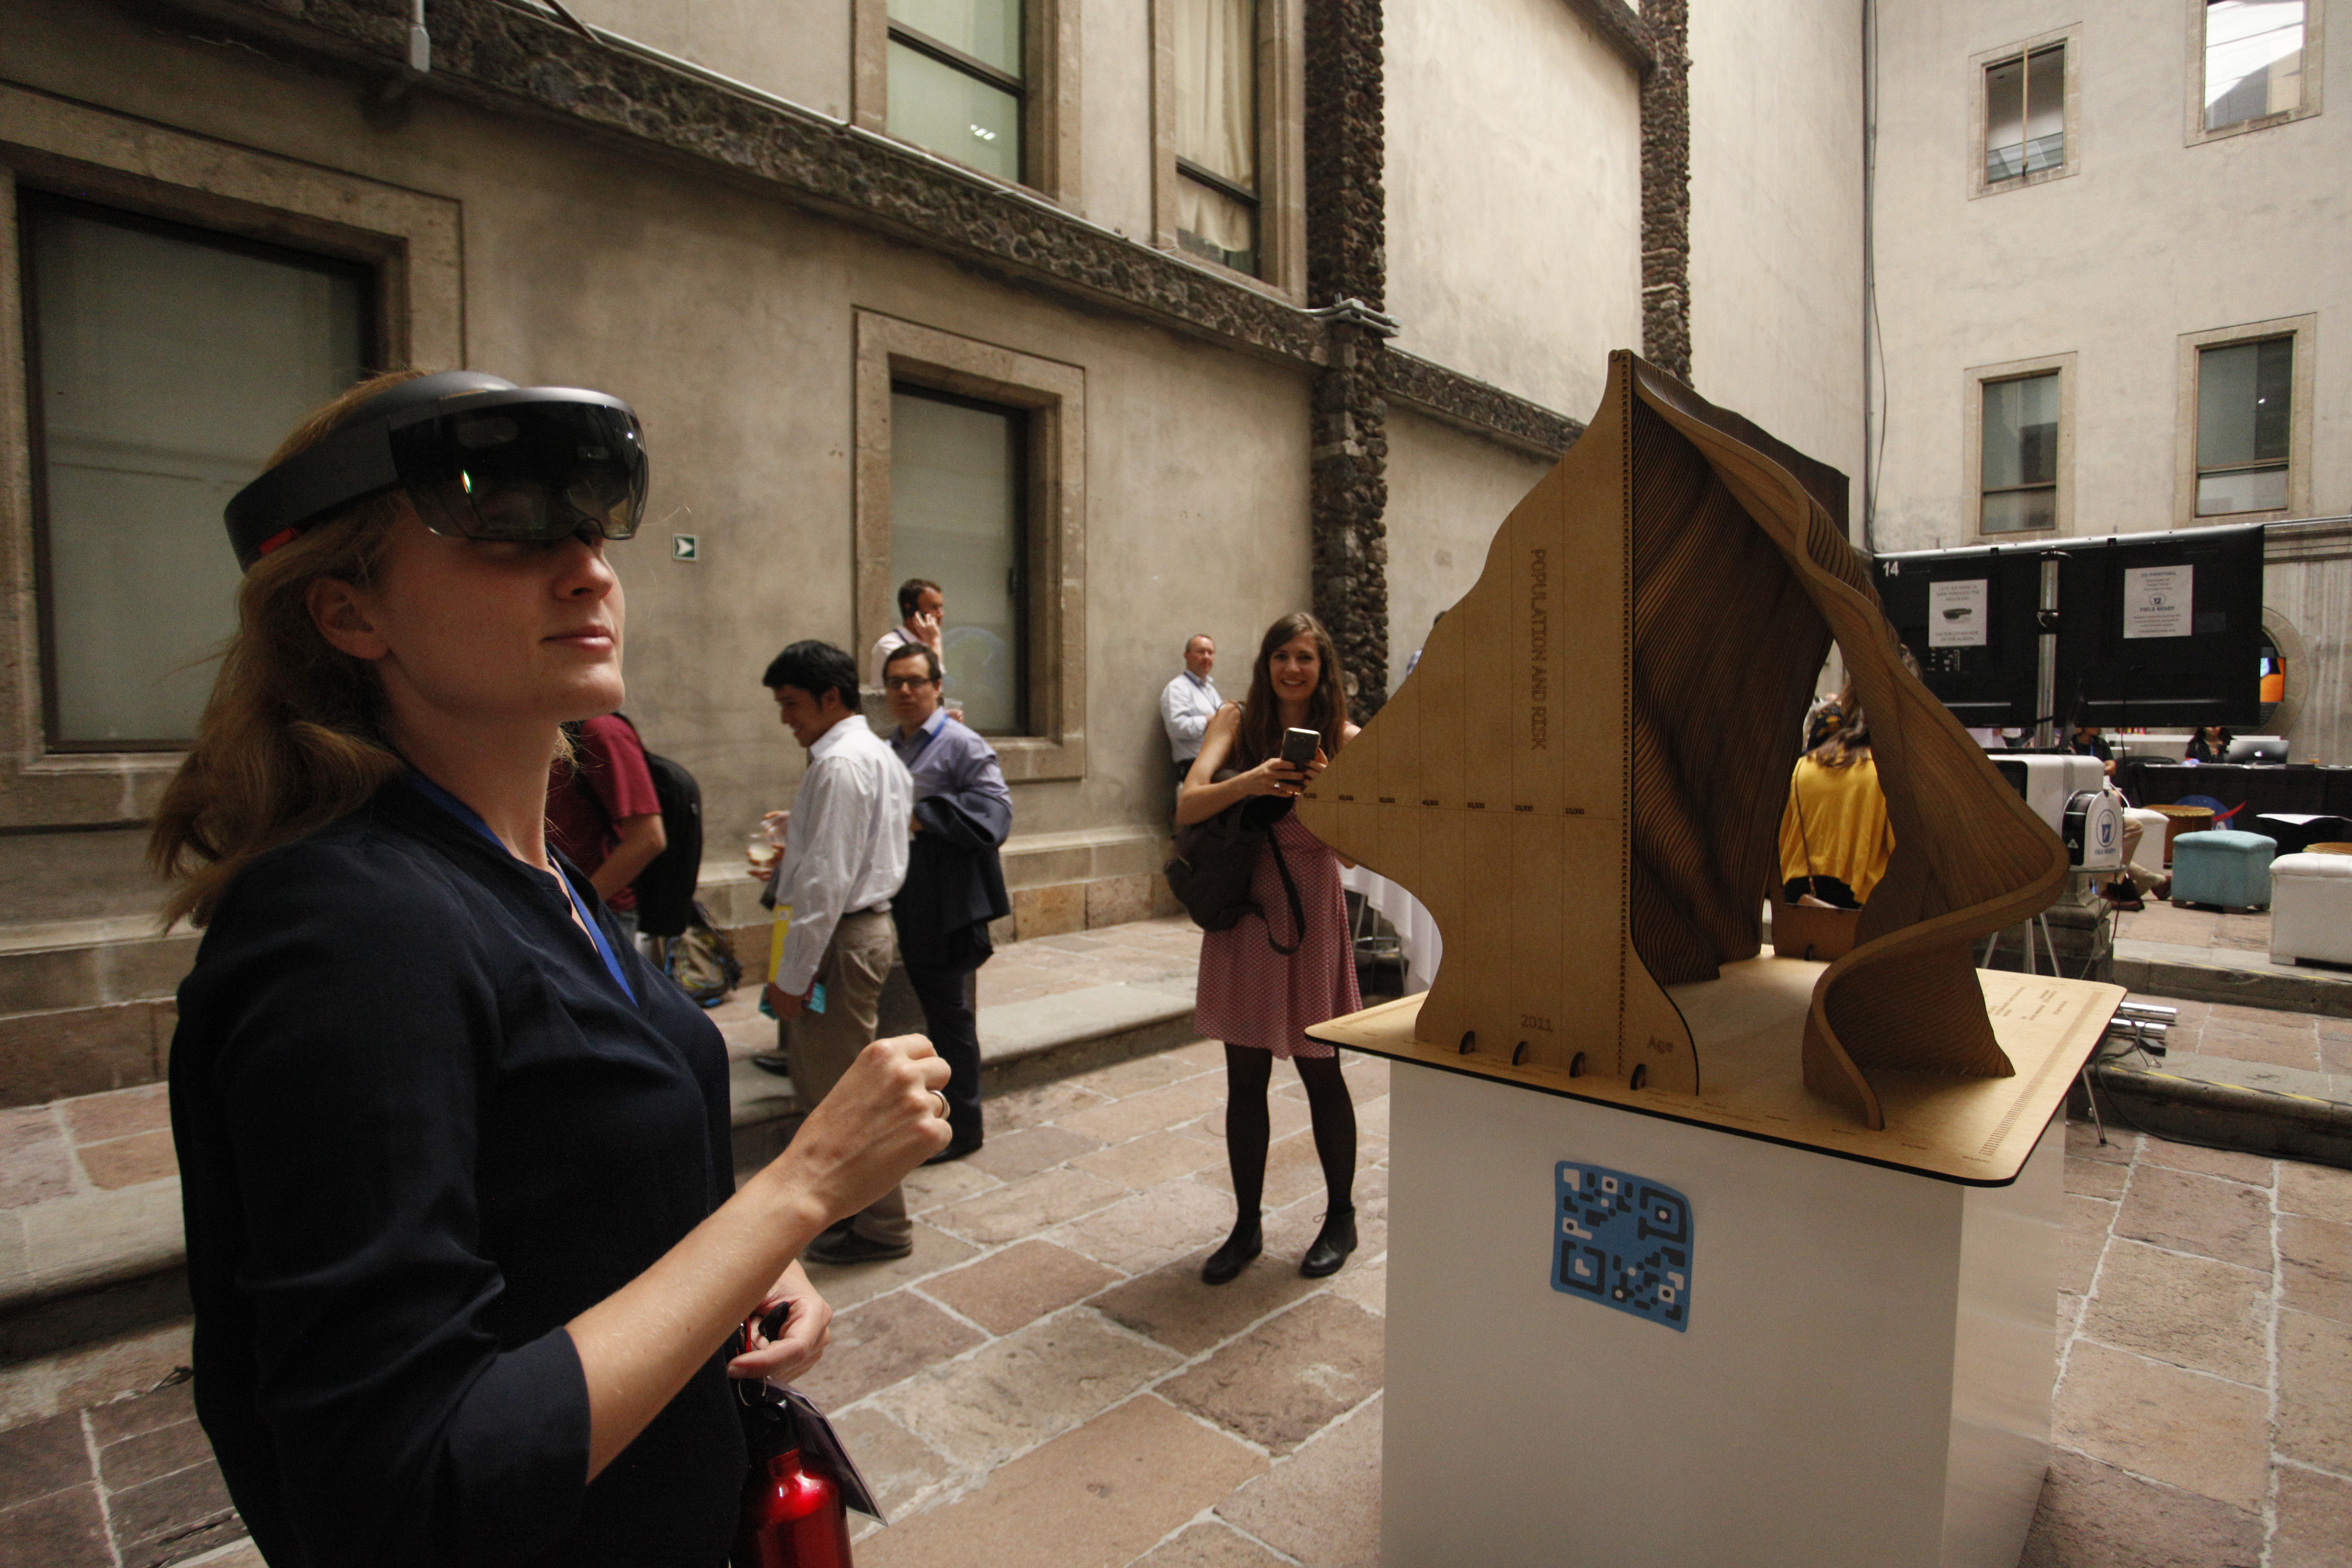
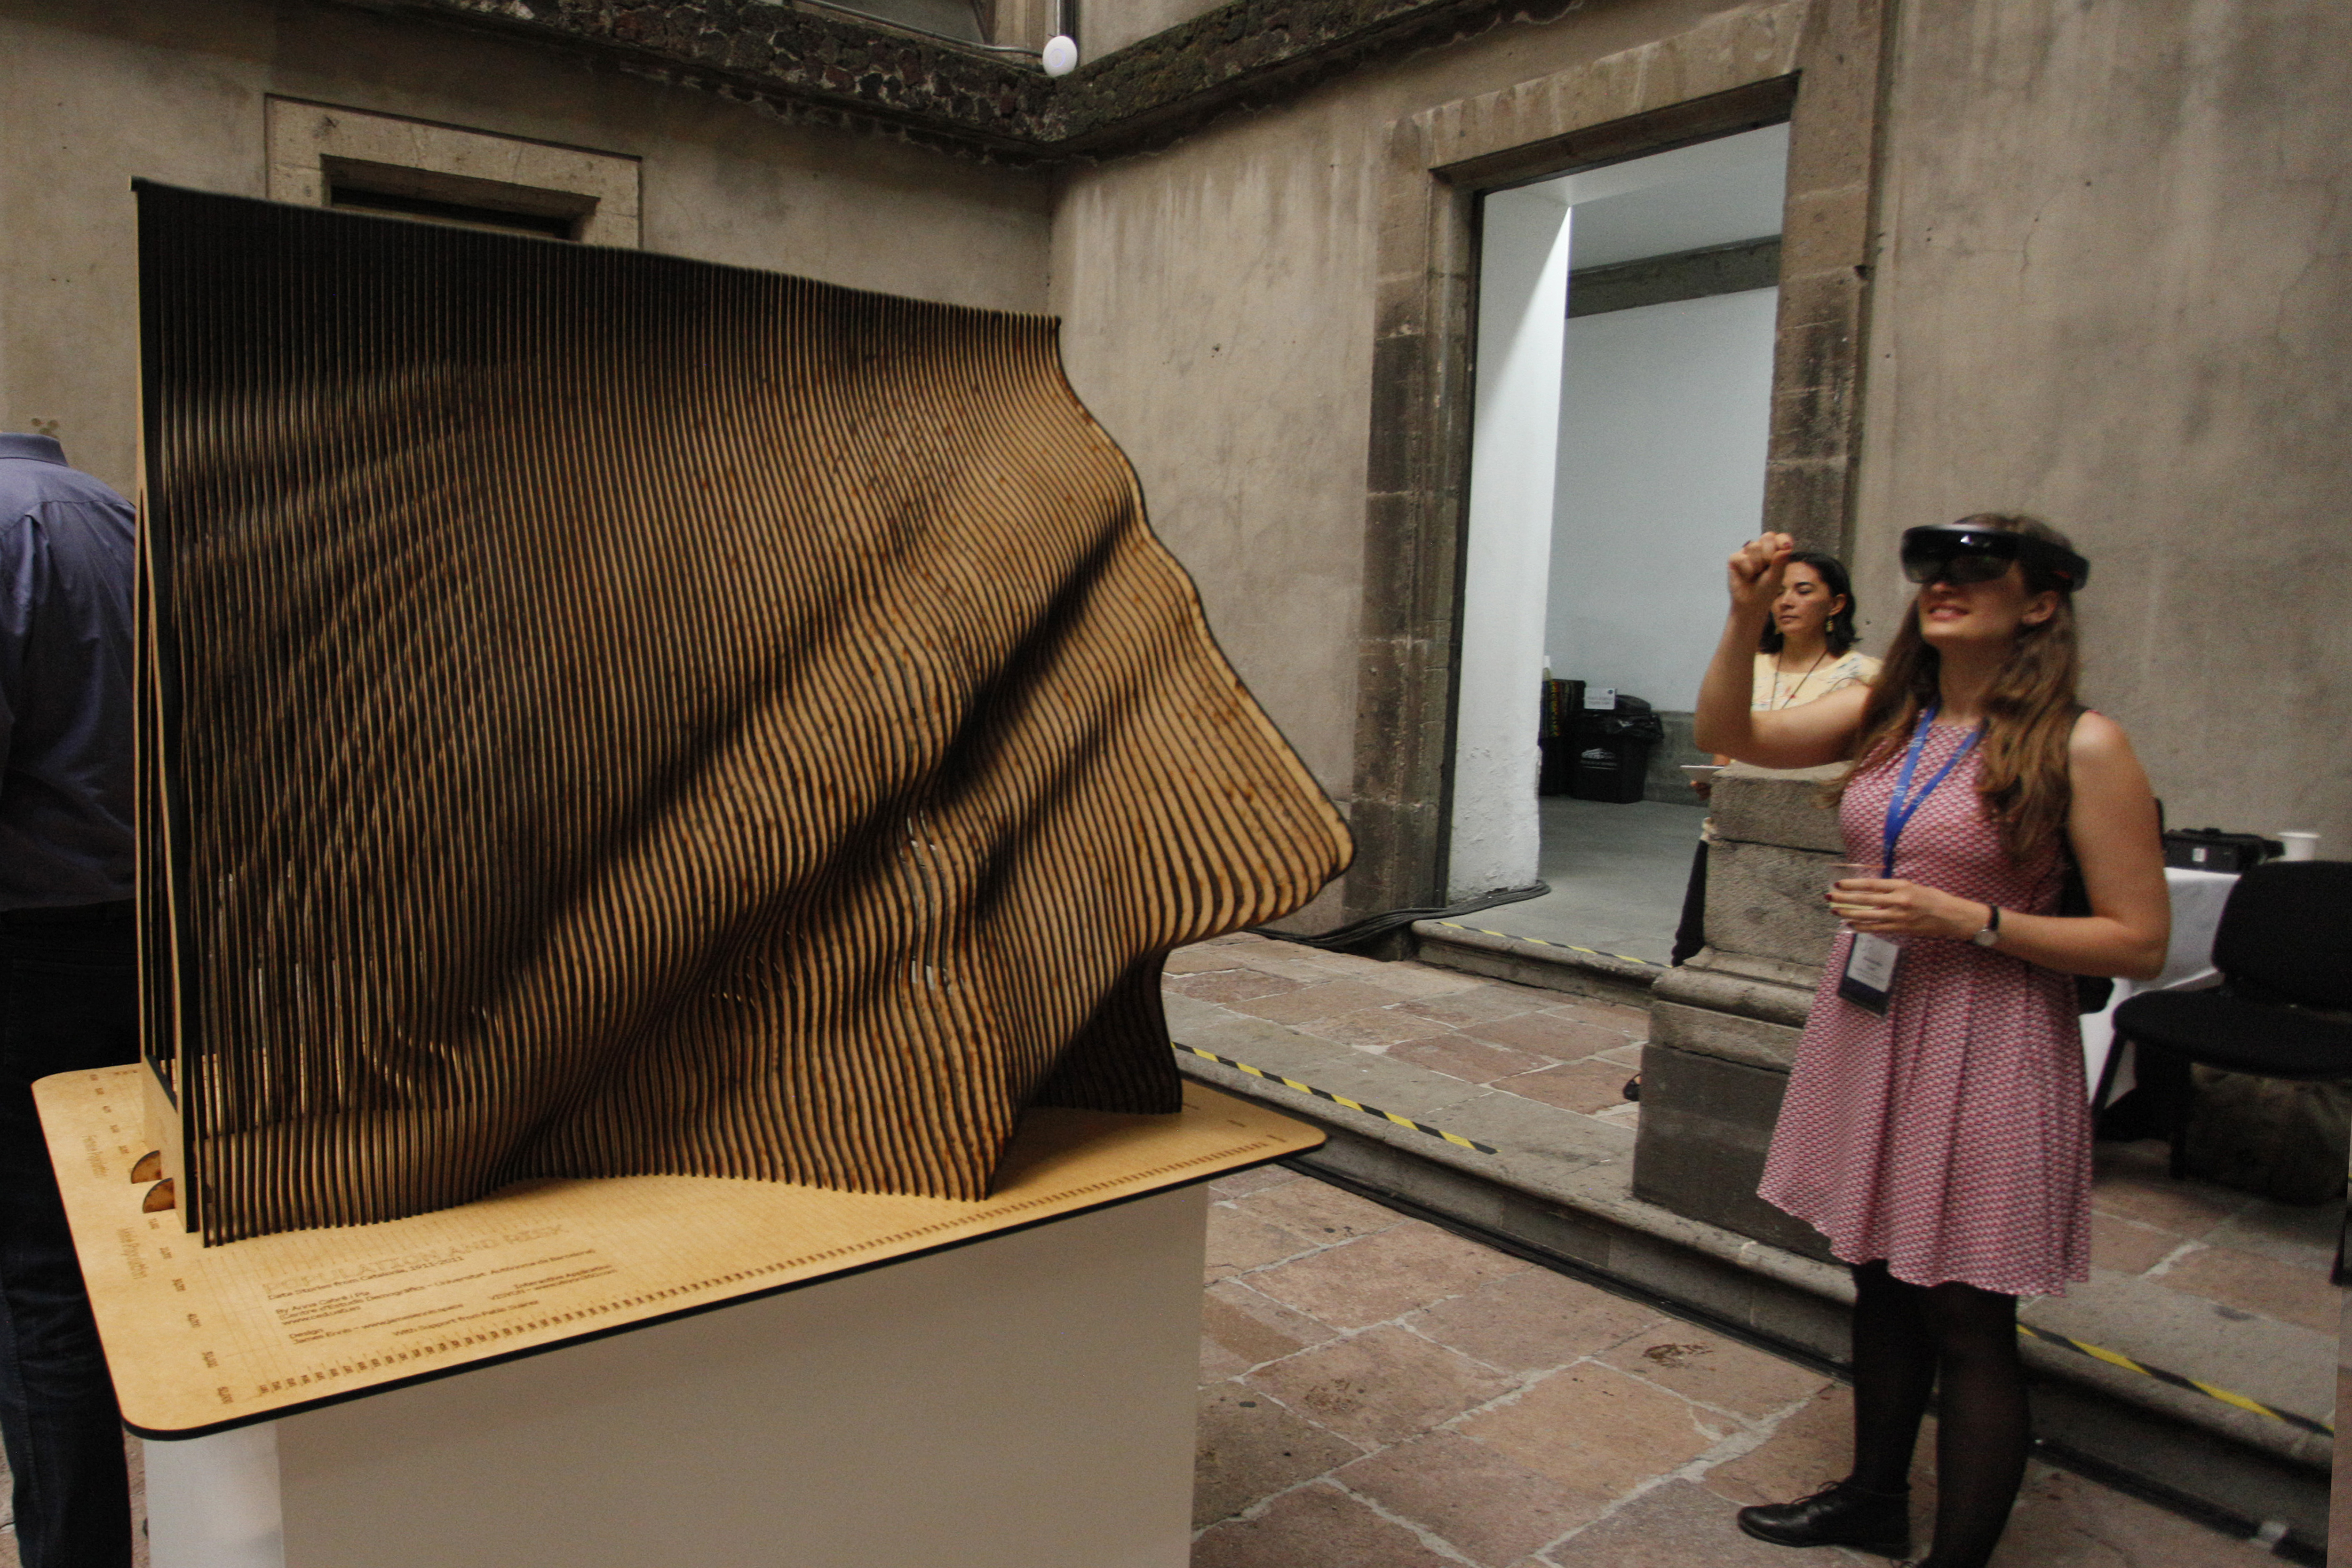
An Augmented Reality experience to support a
Data Sculpture about the links between changing
global risks and changing population dynamics,
as seen through Catalonia, 1901 - 2011
Data Sculpture about the links between changing
global risks and changing population dynamics,
as seen through Catalonia, 1901 - 2011
The Augmented layer was designed to give the audience a introduction and overview of the Sculpture
- To provide information to accompany Sculpture and highlight key dates that are relevant to understanding risk
- To raise awareness and interest in population dynamics and their interaction with world events shaping local risks over time.
- To provide information to accompany Sculpture and highlight key dates that are relevant to understanding risk
- To raise awareness and interest in population dynamics and their interaction with world events shaping local risks over time.
